

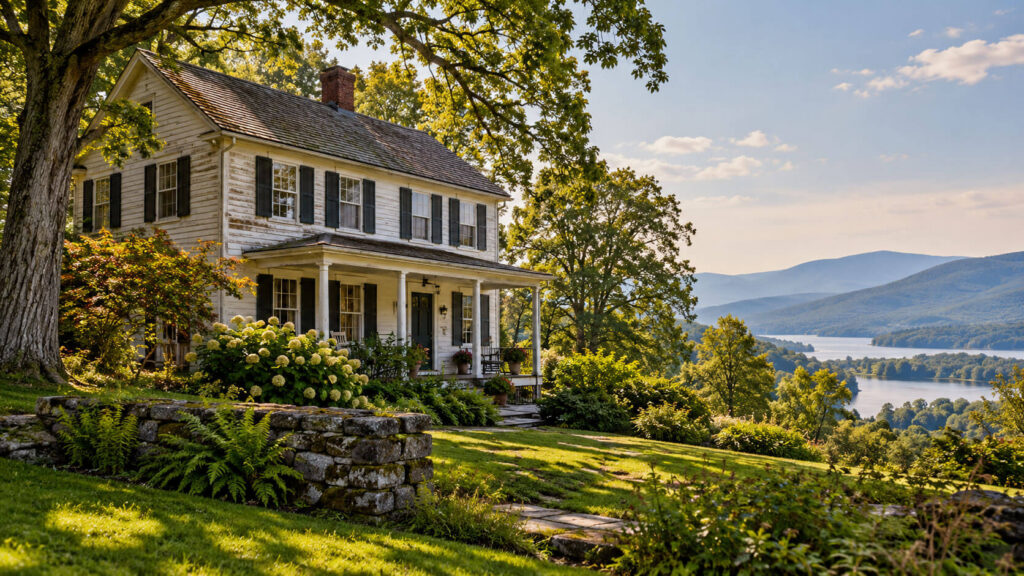
How old are Hudson Valley homes? 67.7% of housing units in HV Trades’ defined ten-county study area were built before 1980—an estimated 786,590 units.
Westchester has the highest estimated pre-1980 share, at 76.0%. Columbia has the highest pre-1940 share, at 31.3%. Explore the county comparisons, construction periods, and owner–renter differences below.
Analysis prepared October 6, 2026. These are five-year survey estimates, not 2026 observations.
Key figures
Across the ten-county study area, the Census estimates 1,161,253 housing units. Of that total:
14.0% of the region’s housing units were built in 2000 or later: an estimated 162,509 units.
The first three categories overlap. A home built in 1935 is included in the before-1940, before-1970, and before-1980 figures. Those percentages should not be added together.
The regional percentages come from adding the county housing counts and dividing by the combined total. They are not an average of ten county percentages, which would give a small county the same weight as a much larger one.
Counties in this study
This analysis defines its Hudson Valley study area as Albany, Columbia, Dutchess, Greene, Orange, Putnam, Rockland, Sullivan, Ulster, and Westchester counties. “Hudson Valley” does not describe the same county grouping in every report, so the ten-county definition matters when comparing these results with another source.
A separate view covers Dutchess, Putnam, and Westchester, the three counties currently central to HV Trades’ directory. Together, they have an estimated 555,977 housing units. Of these, 403,778 were built before 1980, representing 72.6%. Their combined pre-1940 share is 24.7%, or 137,287 units.
Throughout this article, a “housing unit” can be a detached house, an apartment, a condominium unit, or another separate living unit. The headline figures include both occupied and vacant units. They do not count detached houses alone, and they do not count buildings: one apartment building can contain many housing units.
County comparison
These percentages show the share of all housing units within each county in the 2020–2024 estimates. The table starts alphabetically. Select a column heading to sort when interactive controls are available.
67.7%786,590 estimated housing units
Approximate 90% margin of error: ±0.6 percentage points.
Darker counties have a larger share of older housing. This map measures construction age, not property condition.
Source: 2020–2024 ACS B25034. Boundaries: Census 2024 cartographic county files. Map shows only the defined study counties.
Table includes approximate 90% margins of error. On smaller screens, swipe to see all columns.
| Albany | 147,662 | 26.6%±0.9 pp | 55.5%±1.5 pp | 68.4%±1.6 pp | 1964 |
|---|---|---|---|---|---|
| Columbia | 33,393 | 31.3%±1.6 pp | 53.3%±2.4 pp | 66.2%±2.8 pp | 1966 |
| Dutchess | 123,169 | 17.9%±0.8 pp | 48.1%±1.3 pp | 63.7%±1.5 pp | 1971 |
| Greene | 29,080 | 24.5%±1.5 pp | 47.8%±2.5 pp | 61.1%±2.9 pp | 1972 |
| Orange | 149,699 | 20.1%±0.7 pp | 43.9%±1.2 pp | 55.8%±1.4 pp | 1975 |
| Putnam | 38,450 | 17.4%±1.3 pp | 52.9%±2.6 pp | 66.8%±3.0 pp | 1968 |
| Rockland | 108,945 | 10.7%±0.7 pp | 49.0%±1.6 pp | 66.4%±1.9 pp | 1971 |
| Sullivan | 49,994 | 20.1%±1.5 pp | 45.5%±2.2 pp | 57.5%±2.5 pp | 1974 |
| Ulster | 86,503 | 26.5%±1.4 pp | 53.8%±2.0 pp | 66.4%±2.3 pp | 1966 |
| Westchester | 394,358 | 27.5%±0.6 pp | 66.1%±1.0 pp | 76.0%±1.1 pp | 1959 |
These are sample-based estimates, not exact inventories of every property. Close differences deserve particular care. For example, Putnam’s pre-1980 estimate is 66.8% with an approximate margin of error of ±3.0 percentage points. A small difference between Putnam and another county is not enough, by itself, to establish a meaningful ranking.
Which county has the highest share of homes built before 1980?
Westchester has the highest point estimate, at 76.0%, representing approximately 299,656 housing units. Its pre-1970 share is also the highest among the study counties, at 66.1%.
Orange has the lowest pre-1980 point estimate in the group, at 55.8%. Even there, more than half of the housing units predate 1980. A county with a comparatively newer housing stock can still contain a substantial number of older homes.
Which county has the most pre-1940 housing?
Columbia has the highest pre-1940 share, at 31.3%, or an estimated 10,443 units. Westchester has the largest number: 108,495 pre-1940 units, making up 27.5% of its much larger housing stock.
Share and count answer different questions. Columbia’s figure describes how common pre-1940 housing is within the county. Westchester’s figure describes the scale of that housing in absolute numbers.
Median year built
The median year built summarizes the midpoint of a county’s housing-age distribution. It is not the average construction year, and it does not describe the age of a property’s roof, wiring, plumbing, or other components.
Westchester’s median year built is 1959, compared with 1971 in Dutchess and 1968 in Putnam. No regional median is reported here, because averaging county medians would not produce a valid median for the combined region.
Homes by construction period
The construction-period breakdown provides more detail than a single age threshold. Unlike the overlapping before-1940, before-1970, and before-1980 figures, each housing unit belongs to only one of the following categories:
Explore a segment for its construction period and estimated count.
Each unit appears in one category. Source: ACS B25034, 2020–2024.
| Construction period | Estimated units | Share |
|---|---|---|
| 1939 or earlier | 268,728 | 23.1% |
| 1940–1949 | 66,101 | 5.7% |
| 1950–1959 | 159,676 | 13.8% |
| 1960–1969 | 147,907 | 12.7% |
| 1970–1979 | 144,178 | 12.4% |
| 1980–1989 | 127,237 | 11.0% |
| 1990–1999 | 84,917 | 7.3% |
| 2000–2009 | 89,677 | 7.7% |
| 2010–2019 | 61,653 | 5.3% |
| 2020 or later | 11,179 | 1.0% |
“1939 or earlier” is the largest single published category, but it spans many more years than the later decade categories. It should not be described as a single decade’s building boom. Among the complete ten-year categories, 1950–1959 accounts for the largest share, at 13.8%.
These figures describe housing units in the survey estimates according to when their structures were built. They are not a historical tally of every building originally constructed during each period, and the “2020 or later” category should not be treated as a complete count of construction through 2026.
Owner-occupied vs. rental housing
Not consistently. Across the ten-county study area, 57.0% of owner-occupied housing units were built before 1970, compared with 52.0% of renter-occupied units. These calculations use each group’s own total and exclude vacant units.
The county comparisons show why a regional generalization can be misleading:
| County | Owner-occupied | Renter-occupied |
|---|---|---|
| Albany | 57.9% | 49.6% |
| Columbia | 50.9% | 51.5% |
| Dutchess | 47.0% | 49.1% |
| Greene | 47.5% | 65.1% |
| Orange | 43.5% | 42.4% |
| Putnam | 50.3% | 54.6% |
| Rockland | 52.7% | 39.5% |
| Sullivan | 45.0% | 46.5% |
| Ulster | 52.5% | 55.3% |
| Westchester | 71.0% | 58.9% |
Westchester is a clear example of the distinction: the pre-1970 share is 71.0% for owner-occupied units and 58.9% for rentals, a difference of 12.0 percentage points. Its published median construction years are 1957 for owner-occupied housing and 1963 for rentals.
Greene shows the opposite pattern, with a higher estimated pre-1970 share among rental units. Small gaps in other counties should not be treated as decisive without considering their margins of error. Tenure describes how a unit is occupied; it does not establish how well that unit has been maintained.
New York and U.S. comparison
The ten-county study area has a larger share of older housing than the United States overall, but a smaller share than New York State:
| Geography | Before 1940 | Before 1970 | Before 1980 |
|---|---|---|---|
| Ten-county study area | 23.1%
|
55.3%
|
67.7%
|
| New York State | 30.3%
|
64.1%
|
73.9%
|
| United States | 11.7%
|
35.5%
|
49.7%
|
The region’s pre-1980 share is 18.1 percentage points higher than the national share and 6.2 points lower than New York State’s. The comparison is about the proportion of older units, not whether homes in one place are in better condition.
Historical change
Comparing two non-overlapping five-year survey periods, 2015–2019 and 2020–2024, shows a shift toward a larger share of housing reported as built in 2000 or later:
- Before 1940: 25.4% in 2015–2019, compared with 23.1% in 2020–2024.
- Before 1970: 59.0%, compared with 55.3%.
- Before 1980: 71.5%, compared with 67.7%.
- Built in 2000 or later: 10.1%, compared with 14.0%.
The since-2000 share increased by 3.9 percentage points. This is a comparison of estimated housing-stock composition, not a count of homes completed between the two periods. Construction, demolition, conversion, differences in reported construction year, and survey estimation can affect the results. A decline in the pre-1940 share does not tell us how many older homes were demolished or renovated.
Housing types
It describes all housing units. A separate Census table estimates that 55.5% of units in the study area are in detached single-family structures, 6.0% in attached single-family structures, and 36.3% in structures with two or more units. Mobile homes and other unit types account for the remaining 2.2%.
That housing-type profile is separate from the age analysis. Multiplying the detached-house share by the pre-1980 share would not tell us how many detached houses were built before 1980; that calculation would assume a relationship the two tables do not establish.
What housing age tells you
A construction date gives a starting point for understanding a home’s history. It does not tell you which systems have been replaced, whether alterations were made, or what remains behind finished walls. A house built in 1925 may have newer mechanical systems than one built decades later.
For a purchase or renovation, useful next steps depend on the property and the planned work:
- Start with the records. Collect available plans, renovation records, inspection reports, and documentation of system replacements.
- Match the assessment to the question. A home inspection and a structural engineering evaluation serve different purposes. Ask what areas and systems will be evaluated and what may remain inaccessible.
- Separate testing from repair. Housing age alone cannot confirm lead, asbestos, or another hazardous material. Where a material or planned disturbance raises a concern, discuss the appropriate assessment with a qualified testing professional before deciding on the work.
- Define the project scope. An architect, engineer, testing professional, and contractor may each have a different role. Confirm what each agreement covers rather than assuming one visit or report answers every question.
Sources and methodology
The age counts come from U.S. Census Bureau ACS table B25034, Year Structure Built. Median construction years come from B25035; owner/renter age comparisons from B25036 and B25037; and the separate housing-type profile from B25024. The analysis uses the 2020–2024 five-year estimates throughout, with 2015–2019 B25034 used only for the historical comparison.
“Before 1940” uses the category “1939 or earlier.” “Before 1970” combines the categories through 1960–1969. “Before 1980” adds the 1970–1979 category. Percentages use unrounded estimates and are displayed to one decimal place; displayed totals may differ slightly because of rounding.
For the ten-county total, approximate 90% margins of error are ±0.3 percentage points for the pre-1940 share, ±0.5 points for pre-1970, and ±0.6 points for pre-1980. Margins for combined figures are calculated using the Census Bureau’s published approximation methods. They describe sampling uncertainty, not every possible source of error.
County rankings in this article are rankings of point estimates. Close values may not be statistically distinguishable. Five-year estimates describe a survey period; they are not a property inventory taken on one date and are not 2026 observations.
Primary sources: Census ACS Summary Files; B25034 table definitions; Census guidance for derived estimates and margins of error (PDF). See the download below for formulas, endpoints, and the historical source.
Suggested citation: Hudson Valley Trades, “Hudson Valley Housing Age Statistics: Homes Built Before 1940, 1970 and 1980 by County,” analysis of U.S. Census Bureau 2020–2024 ACS five-year estimates, prepared October 6, 2026. Identify the table and county grouping when quoting a specific figure.
Frequently asked questions
How many Hudson Valley housing units were built before 1940?
The estimated count is 268,728 in HV Trades’ defined ten-county study area, representing 23.1% of all housing units in the 2020–2024 ACS estimates. Within Dutchess, Putnam, and Westchester alone, the estimated count is 137,287.
What is the median year built for Westchester homes?
The Census Bureau reports 1959 as Westchester’s median year built for all housing units. This is a housing-stock measure, not the age of the typical home’s current roof, heating equipment, or other components.
Can these figures tell me how many homes were built before 1978?
No. The construction-period categories used here combine 1970 through 1979. They cannot separate 1970–1977 from 1978–1979, so the before-1980 figure should not be relabeled as a before-1978 count.
Does an old construction year mean a home needs major repairs?
No. Construction age does not measure present condition or the history of repairs and replacements. A property-specific assessment is needed to address a particular concern, and its scope depends on the provider’s agreement, methods, and access.
Are apartments counted separately from the buildings they are in?
Yes. The unit of measurement is the housing unit. A building with ten separate apartments can contribute ten housing units to the same construction-period category. The figures should not be described as counts of buildings.
Why might another Hudson Valley report show a different percentage?
Check its county list, survey period, and denominator. A report using fewer counties, an earlier ACS release, or only occupied housing units can produce a different result without using the same measure incorrectly.
Download the data
Use the county estimates, margins of error, and defined geography in your reporting. These files contain the underlying values used throughout this post.
Source: U.S. Census Bureau. Regional aggregation and analysis: HV Trades. Prepared October 6, 2026. Downloads are embedded in this post.
Planning work on an older home
If you are planning work on an older home, start with the property’s records and the question you need answered. Use HV Trades to explore local contractors and service providers, then ask about the relevant scope of inspection, testing, design, or construction before arranging the work.
